
This is part 1 of a four part series in the Energy Diagram Module.
In order to talk about reaction mechanisms, we have to first understand what makes up a reaction. It may help to think of a reaction as a landscape. Let us look at the components in Graph 1 below.
- the x-axis as the reaction proceeds (the reaction coordinate).
- The potential energy of the molecules throughout the reaction along the y-axis.
- The shape of the line graph represents the pathway (or mechanism) by which the reactants must take to reach the products.
- Using the landscape analogy, reactants and products that are stable can be thought of as the “valleys”, which have some potential energy (refer to Graph 1).
- As reactants collide during the course of a reaction, they must go over a “hill” in order to each the product of the reaction. This hill represents the energy needed to break the existing bonds in the reactions (the activation energy, ΔG‡)
- At the top of the hill, some hybrid molecule (the transition state, [ ]‡) is formed which represents the simultaneous (often referred to as concerted) bond breaking and bond forming. Because of the hybrid nature of the molecule, transition states are NOT isolatable.
The activation energy is usually provided by sum of the surrounding system and the collision of the reactant molecules. For reactions with high activation energy barriers, a Bunsen burner or heating element can be used to add energy. Looking at Graph 2, as transition states form, the reaction can “roll” downhill both ways, backwards to reactants or forwards to products. As products begin to form, which as illustrated is much lower in energy than the reactants, the net release of energy (the heat of reaction, ΔH0) is released back to the surrounding system in the form of heat (enthalpy).
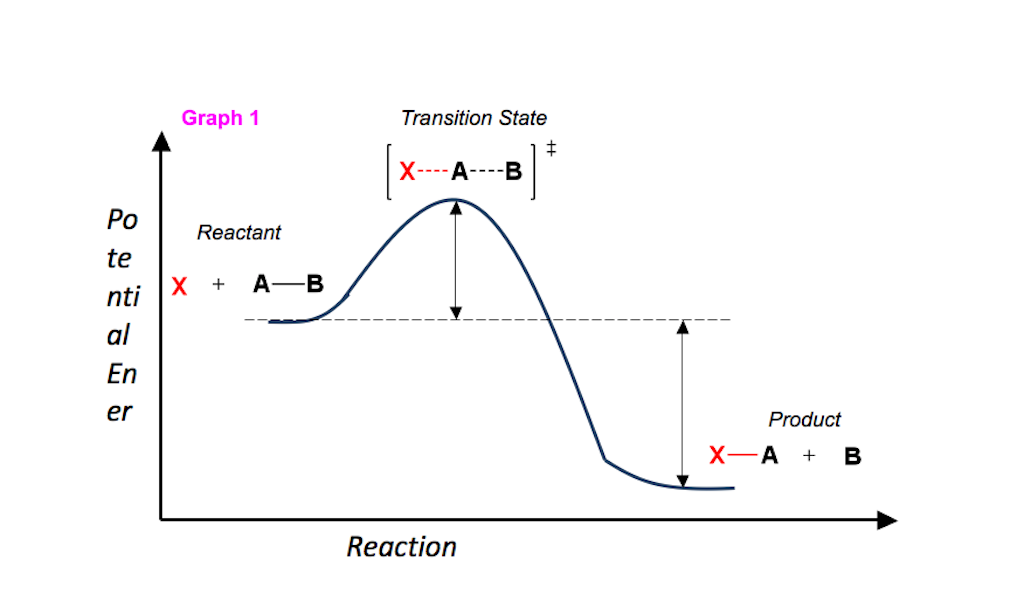
Graph 1
(click on photo to enlarge)

Graph 2
(click on photo to enlarge)