
Studying ahead for Organic Chemistry this Spring semester is a good way for getting the best grade this semester and keeping up with the rigorous course work in Orgo 2. Most students find the pace of this class very challenging compared to other courses. This is because while there is a lot of information to learn, it also builds on previous concepts from Orgo 1, a course most students want to forget! In your time before classes begin, consider reading ahead or brushing up on some concepts that were covered late last semester to give you a boost right away.
But don’t worry! StudyOrgo has you covered. Our Editors have spent years tutoring and teaching Organic Chemistry to students and we have seen all of the pitfalls common to the first few weeks of the semester. Our online platform allows members to learn organic chemistry concepts and mechanisms quickly and the material presented in an easy-to-follow format. Follow along with us and sign up with StudyOrgo today to help prepare you for all of your Organic Chemistry questions.
One of the concepts you will need to have mastered quickly in Orgo 2 is the usefulness of Infrared (IR) Spectrometry. In this article, we will break down the key concepts and give you all the info you need to master this technique quickly.
IR Spectroscopy Principles
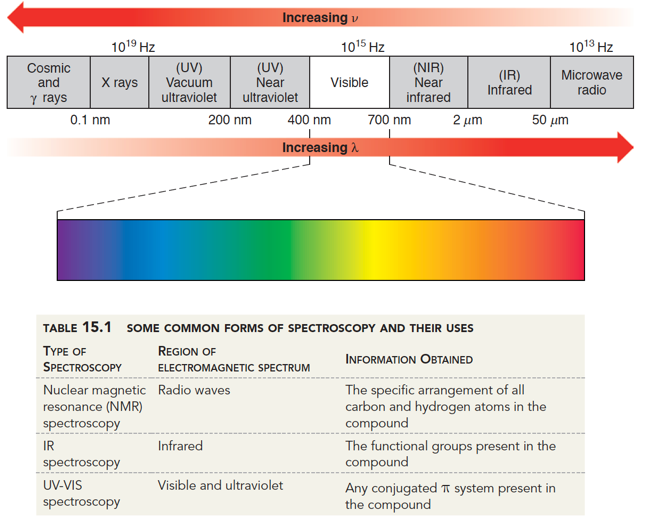
A usefulness of using light for analysis is it is relatively non-destructive and cheap to produce. We can see that there are many regions of electromagnetic radiation that we can use for molecular predictions. For instance, long wavelengths like microwaves are used in NMR for determining atomic structure. Longer wavelengths like IR and UV/Vis region are used for predicting functional groups and can help you identify unknown compounds.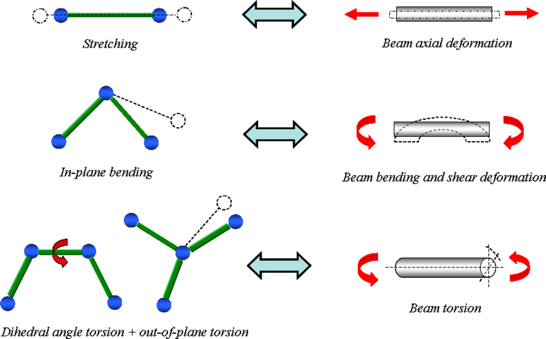
Infrared radiation causes vibrating the bonds between atoms. This is a similar principle to how heating up molecules works, and you may have heard of infrared imaging systems, which can measure the relative temperature of molecules. This technology works on a similar principle to IR spectroscopy, but we use it in the lab to determine functional groups.
Higher energy regions of the IR spectrum (larger wavenumbers) will cause stretching of bonds where lower energy regions (smaller wavenumbers) will cause bending and twisting. Thus, depending on the type of bond and the atoms involved in the bond, we can predict what they are based on which wavenumber region they absorb.
There are 3 pieces of information you can get from the IR spectrum of samples.
Signal Region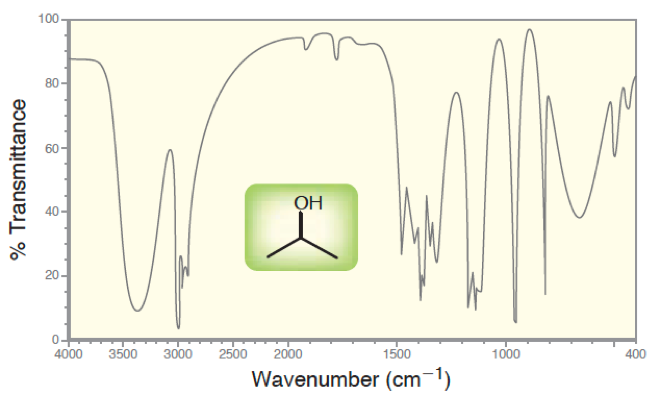
In the graph above, we can see the IR spectrum for isopropanol. We see that the range of wavenumbers (inversely proportional to wavelength), there are multiple regions that are causing unqiue-looking signals. The functional groups are alkane and alcohol. Almost all your moleucles will have C-C and C-H bonds, so many o fhtese signals are not useful. But an alcohol is unqiue, with a large peak at 3400.
Signal Intensity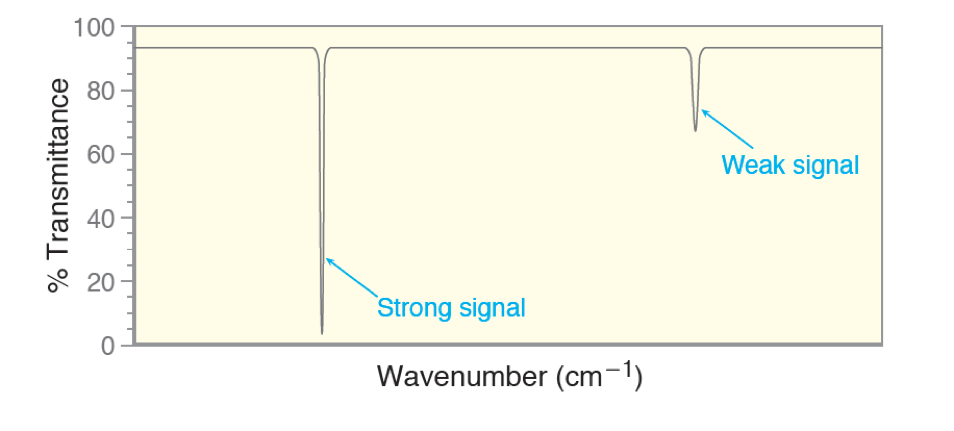 Some signals will be weak and some will be strong, as we see in the figure above. This has to do with how efficiently the region is being absorbed by the molecule. If it is a strong signal it should be consistent and easy to detect. However some bonds are not as efficient. With these signals, sometimes you miss them because they are too weak. So if you think you may have a functional group but the peak is not there, remember it maybe “invisible” if it is a weak signal.
Signal Shape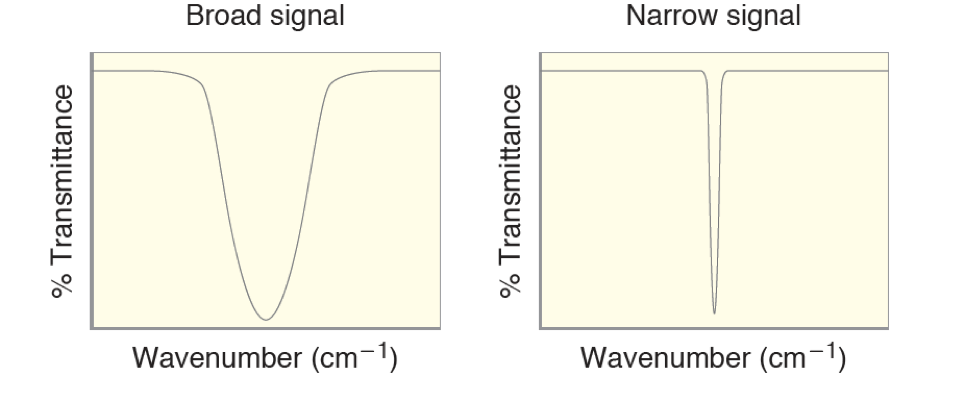 Most types of bonds will absorb in a very narrow region of the IR, giving the typical narrow signal shape. Only a few types of bonds will case large regions of the spectrum to absorb, causes a broad signal. These always are functional groups that can undergo hydrogen bonding, such as O-H, N-H, C=O, etc. Typcially OH and COOH functional groups are very broad, while carbonyls are amines are more broad than ususal.
Common signals used to predict functional groups
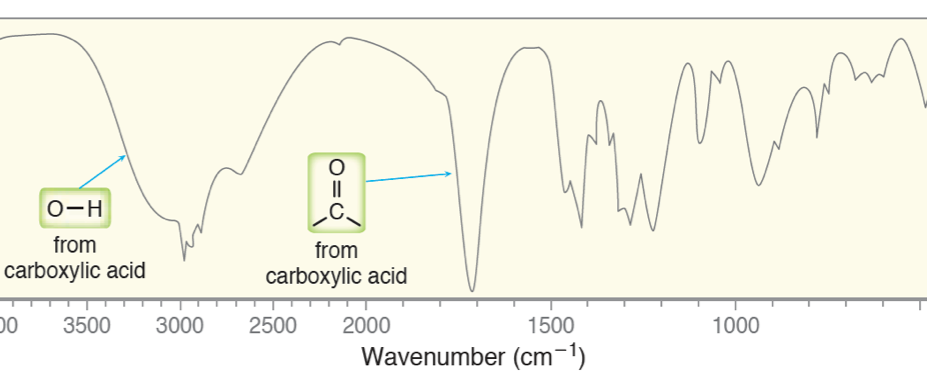
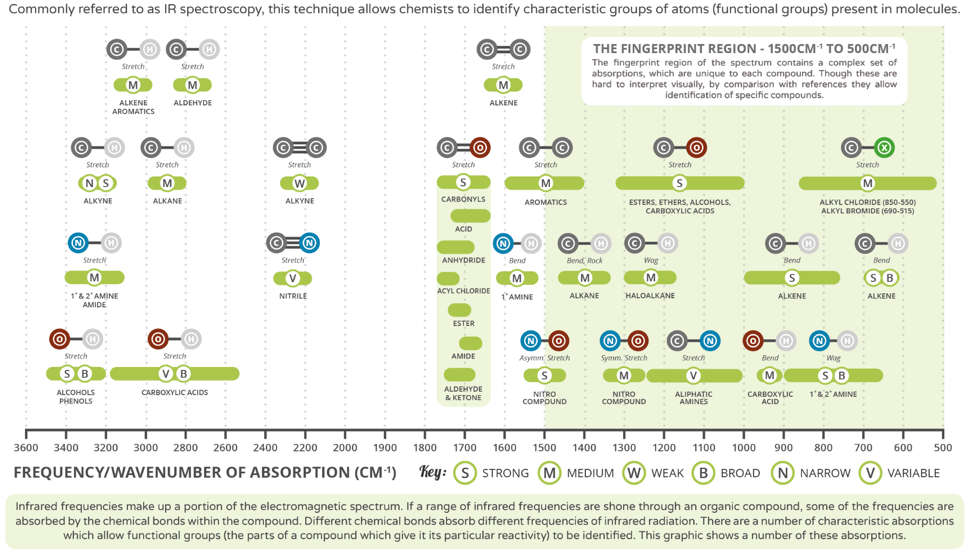
We have placed a typical carboxylic acid spectrum on top of this trend chart to help you learn the various signals that you will encounter. Signals in the “fingerprint” region are useful for matching you unknown to a known standard, too usually too “noisey” to predict anything. You can see that the broad OH peak at 3400 cm-1 and the C=O peak at 1710 cm-1 falls very neatly in the trend.
This is just an example of the clear-cut description of Orgo 2 concepts that we explain at StudyOrgo.com. Sign up to day to get ahead on over 175 reactions commonly covered in these classes!